
Author: Lei Li (Software engineer at DigitalChina)
Transcreator: Yajing Wang; Editors: Tom Dewan, Ran Huang
Chaos Mesh is a cloud-native chaos engineering platform that orchestrates chaos experiments on Kubernetes environments. It allows you to test the resilience of your system by simulating problems such as network faults, file system faults, and Pod faults. After each chaos experiment, you can review the testing results by checking the logs.
But this approach is neither direct nor efficient. Therefore, I decided to develop a daily reporting system that would automatically analyze logs and generate reports. This way, it’s easy to examine the logs and identify the issues.
In this article, I will introduce how chaos engineering helps us improve our system resilience and why we need a daily reporting system to complement Chaos Mesh. I’ll also give you some insights about how to build a daily reporting system, as well as the problems I encountered during the process and how I fixed them.
What is Chaos Mesh and how it helps us
Chaos Mesh is a Chaos Engineering platform that orchestrates faults in Kubernetes. With Chaos Mesh, we can conveniently simulate extreme cases in our business and test whether our system remains intact.
At my company, Digital China, we combine Chaos Mesh with our DevOps platform to provide a one-click CI/CD process. Every time a developer submits a piece of code, it triggers the CI/CD process. In this process, the system builds the code and performs unit tests and a SonarQube quality check. It then packages the image and releases it to Kubernetes. At the end of the day, our daily reporting system pulls the latest images of each project and performs Chaos Engineering on them.
The simulation doesn’t require any application code change; Chaos Mesh takes care of the hard work. It injects all kinds of physical node failures into the system, such as network latency, network loss, and network duplication. It also injects Kubernetes failures, such as Pod or container faults. These faults may reveal vulnerabilities in our application code or the system architecture. When the loopholes surface, we can fix them before they can do real damage in production.
Spotting these vulnerabilities isn’t easy, however: the logs must be carefully read and analyzed. This can be a difficult job for both the application developer and the Kubernetes specialist. The developer may not work well with Kubernetes; a Kubernetes specialist, on the other hand, may not understand the application logic.
This is where the Chaos Mesh daily reporting system comes in. After the daily chaos experiments, the reporting system collects logs, draws a plot, and provides a web UI for analyzing the possible loopholes in the system.
In the following sections, I’ll explain how to run Chaos Mesh on Kubernetes, and how to generate daily reports, and build a web application for daily reporting. You’ll also see an example of how the system helps out in our production.
Run Chaos Mesh on Kubernetes
Chaos Mesh is designed for Kubernetes, which is one of the important reasons why it can allow users to inject faults into the file system, Pod, or network for specific applications.
In earlier documents, Chaos Mesh offered two ways to quickly deploy a virtual Kubernetes cluster on your machine: kind and minikube. Generally, it only takes a one-line command to deploy a Kubernetes cluster as well as install Chaos Mesh. But starting Kubernetes clusters locally affects network-related fault types.
If you use the provided script to deploy a Kubernetes cluster using kind, then all the Kubernetes nodes are virtual machines (VM). This adds difficulty when you pull the image offline. To address this issue, you can deploy the Kubernetes cluster on multiple physical machines instead, with each physical machine acting as a worker node. To expedite the image pulling process, you can use the `docker load` command to load the required image in advance. Apart from the two problems above, you can install kubectl and Helm by following the documentation.
Before you install Chaos Mesh, you need to first create CRD resources:
git clone https://github.com/pingcap/chaos-mesh.git
cd chaos-mesh
# Create CRD resources
kubectl apply -f manifests/
After that, install Chaos Mesh using Helm:
# For Helm 2.X
helm install chaos-mesh/chaos-mesh –name=chaos-mesh –namespace=chaos-testing
# For Helm 3.X
helm install chaos-mesh chaos-mesh/chaos-mesh –namespace=chaos-testing
To run a chaos experiment, you have to define the experiment in YAML files and use `kubectl apply` to start it. In the following example, I create a chaos experiment using PodChaos to simulate a Pod fail:
apiVersion: chaos-mesh.org/v1alpha1
kind: PodChaos
metadata:
name: pod-failure-example
namespace: chaos-testing
spec:
action: pod-failure
mode: one
value: ”
duration: ’30s’
selector:
namespaces:
– chaos-demo-1
labelSelectors:
‘app.kubernetes.io/component’: ‘tikv’
scheduler:
cron: ‘@every 2m’
Let’s apply the experiment:
kubectl apply -f podfail.yamlGenerate a daily report
For demonstration purposes, in this post I run all the chaos experiments on TiDB, an open-source, distributed SQL database. To generate daily reports, you need to collect logs, filter errors and warnings, draw a plot, and then output a PDF.
Collect logs
Usually, when you run chaos experiments on TiDB clusters, many errors are returned. To collect those error logs, run the kubectl logs command:
kubectl logs <podname> -n tidb-test -–since=24h >> tidb.logAll logs generated in the past 24 hours of the specific Pod in the tidb-test namespace are saved to the tidb.log file.
Filter errors and warnings
In this step, you have to filter error messages and warning messages from the logs. There are two options:
- Use text-processing tools, such as
awk. This requires a proficient understanding of Linux/Unix commands. - Write a script. If you’re not familiar with Linux/Unix commands, this is the better option.
The extracted error and warning messages will be used in the next step for further analysis.
Draw a plot
For plotting, I recommend gnuplot, a Linux command-line graphing utility. In the example below, I imported the stress test results and created a line graph to show how queries per second (QPS) are affected when a specific Pod becomes unavailable. Since the chaos experiment was executed periodically, the number of QPS exhibited a pattern: it would drop abruptly and then quickly return to normal.
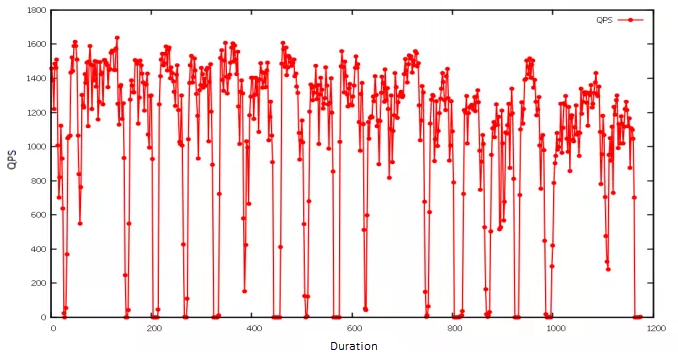
QPS line graph
Generate the report in PDF
Currently, there is no available API for generating Chaos Mesh reports or analyzing results. My suggestion is to generate the report in PDF format so it will be readable on different browsers. In my case, I use gopdf, a support library that allows users to create PDF files. It also lets you insert images or draw tables, which meets the needs of a Chaos Engineering report.
The last step is to simply run the whole system at a scheduled time every day. My choice is crond, a command-line utility that executes cron jobs in the background, to execute the commands early each morning. So, when I start work, there is a daily report waiting for me.
Build a web application for daily reporting
But I want to make the report more readable and accessible. Isn’t it nicer if you can check reports on a web application? At first, I wanted to add a backend API and a database to store all report data. It sounds applicable, but it may be too much work, since all I want is to know which report requires further troubleshooting. The exact information is shown in the file name, for example: report-2021-07-09-bad.pdf. Thus, the reporting system’s workload and complexity are greatly reduced.
Still, it is necessary to improve the backend interfaces as well as enrich the report content. But for now, a daily, workable reporting system is just fine.
In my case, I used Vue.js to scaffold the web application using a UI library antd. After that, I updated the page content by saving the automatically generated report to the static resources folder static. This allows the web application to read the static reports and then render them to the front end page. For details, check out Use antd in vue-cli 3.
Below is an example of a web application that I developed for daily reporting. The red card indicates that I should check the testing report because exceptions are thrown after running chaos experiments.
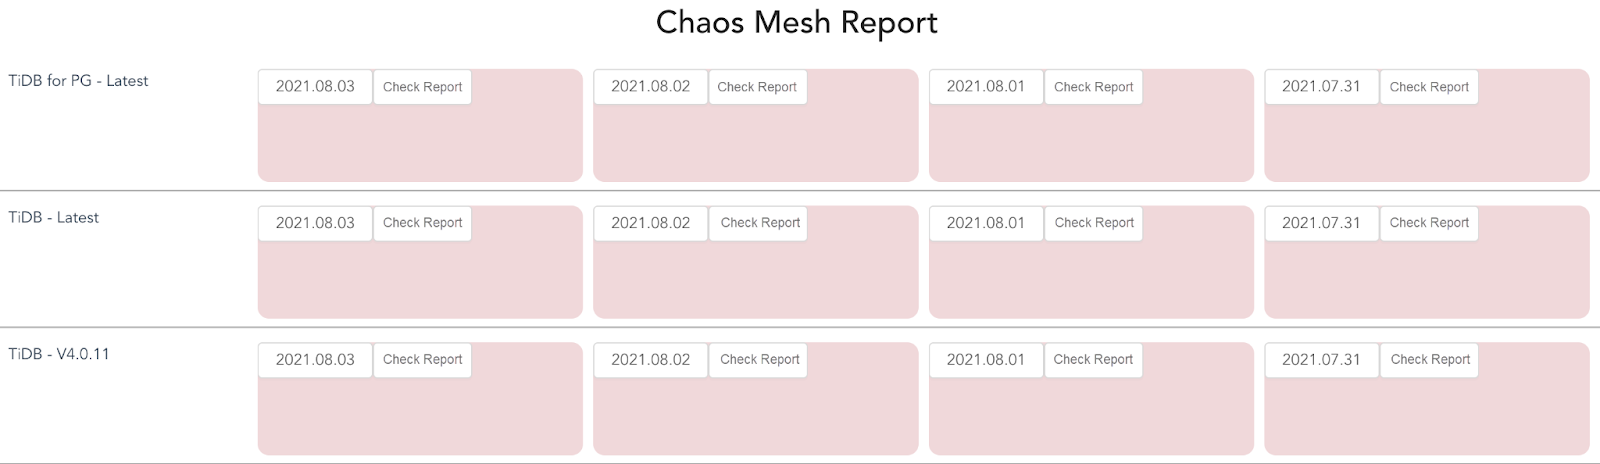
Web application for daily reporting
Clicking the card will open the report, as shown below. I used pdf.js to render the PDF.
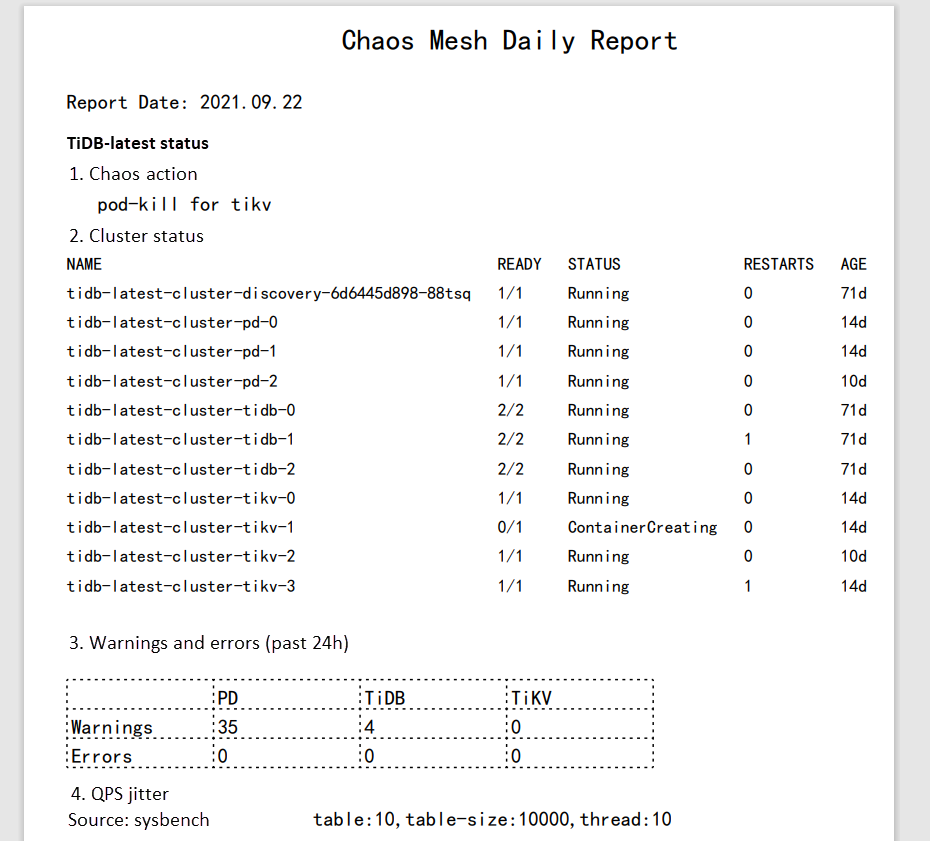
Daily report in PDF
Summary
The Chaos Mesh daily reporting system has been live in our company for four months. Luckily, the system has helped us discover bugs for multiple projects in extreme cases. For example, one time we injected a network duplicate and network loss failure into an application and set the duplication and package loss ratio at a high level. As a result, the application met unexpected situations during message parsing and request dispatch. A fatal error was returned, and the program abnormally exited. With the help of the daily report, we quickly obtained the plot and logs for the specific error. We used that information to easily locate the cause of the exception, and we fixed the system vulnerability.
Chaos Mesh enables you to simulate faults that most cloud-native applications might encounter. In this article, I created a PodChaos experiment and observed that QPS in the TiDB cluster was affected when the Pod became unavailable. After analyzing the logs, I can enhance the robustness and high availability of the system. I built a web application to generate daily reports for troubleshooting and debugging. You can also customize the reports to meet your own requirements.
This article was first published on The New Stack.


TiDB Dedicated
A fully-managed cloud DBaaS for predictable workloads
TiDB Serverless
A fully-managed cloud DBaaS for auto-scaling workloads